The Industry Standard for Power Quality Database Management & Analysis Software
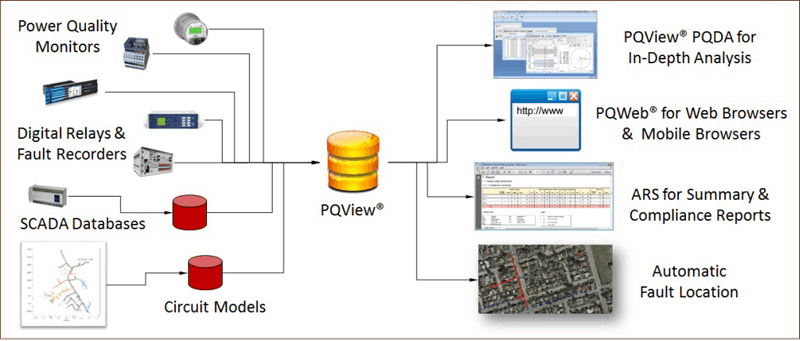
PQView® Integrates Data from Power Quality Monitors, Digital Relays, Fault Recorders, Smart Meters, and SCADA Databases
PQView® 4
PQView® เป็นระบบซอฟต์แวร์ที่หลากหลายองค์ประกอบ ได้รับการพัฒนาโดย Electrotek Concepts® และ EPRI® สำหรับการสร้างและวิเคราะห์ฐานข้อมูลพลังงาน พลังงานคุณภาพไฟฟ้า การวัดพลังงาน และพร้อมใช้งานกับการกำหนดค่าของเครื่องมือ Dranetz Encore
PQView ได้รวมข้อมูลจากเครื่องถ่ายทอดกระแสไฟฟ้าไมโครโปรเซสเซอร์ เครื่องบันทึกความผิดพลาดแบบดิจิตอล จอเครื่องวัดคุณภาพไฟฟ้า
มิเตอร์อัจฉริยะ นักประวัติศาสตร์ควบคุมกำกับดูแลและเก็บข้อมูล (SCADA) ลงในฐานข้อมูลเชิงสัมพันธ์แบบเปิด
โมดูลในการวิเคราะห์ข้อผิดพลาด PQView รวมการบันทึกระบบพลังงานไฟฟ้าอัตโนมัติเข้ากับข้อมูลจาก SCADA, GIS และ เครือข่ายโทโปโลยี เพื่อระบุตำแหน่งความผิดปกติโดยการประมาณการ และเพื่อส่งสัญญาณเตือนไปยังบุคลากรฝ่ายปฏิบัติการ ช่วยลดเวลาในการค้นหาความผิดพลาดเป็นรายชั่วโมง
• ลดเวลาในการค้นหาความผิดพลาด
• ลดเวลาในการจำแนกประเภทของความผิดพลาด
• ลดความระยะเวลาความผิดพลาด
PQView Answer Modules® ประเมินความสมบูรณ์และทิศทางของตัวการสลับตัวเก็บประจุอัตโนมัติ บันทึกปฏิกิริยาการเปลี่ยนแปลงพลังงาน และทิศทางของแรงดันไฟฟ้าตก
PQView รวมคุณสมบัติที่มีประสิทธิภาพในส่วนอินเตอร์เฟซที่ใช้งานได้ง่าย การวัดสามารถเก็บไว้ในMicrosoft® Access หรือ Microsoft SQL Server ระบบของ PQView ที่สมบูรณ์ประกอบด้วยการใช้งาน 3 หลักดังนี้ เครื่องมือจัดการข้อมูลคุณภาพไฟฟ้า (PQDM) การวิเคราะห์ข้อมูลคุณภาพไฟฟ้า (PADA) และ PQWeb®

The Industry Standard for Power Quality Database Management & Analysis Software
PQView® Integrates Data from Power Quality Monitors, Digital Relays, Fault Recorders, Smart Meters, and SCADA Databases
Event analysis
PQView can be used to display voltage and/or current waveforms from events. Derivations from waveform samples include interactive phasor charts, spectrum charts from one- to twelve-cycle FFT and DFT transformations, filtered charts, positive-, negative-, and zero-sequence components, voltage transformations through one to four transformer connections, and IEEE P1409 missing voltage. PQDA can quickly build event lists from the millions of events recorded in a measurement database. PQView “measurement events” consist of the waveform and rms samples recorded during voltage sags and swells due to faults and motor starting, and voltage transients due to fuse operations, lightning strikes, load switching, and capacitor and cable energizing. The event lists can be built based on simple queries that only select certain meters for a specific date range. Or, they can be more sophisticated, searching for single-phase sags, three-phase sags, single-phase faults, and three-phase faults.
RMS Voltage Variation Analysis
PQDA can build ITIC Charts, CBEMA Charts, and SEMI F47 Charts, and custom charts that overlay multiple curves. Measurements from each meter can be plotted optionally in a different color. Because PQDA’s rms variation analysis algorithm involves temporal aggregation of multiple events occurring closely in time, users see the event that resulted in a particular voltage magnitude and duration, along with any other events that occurred around the same time at that location.
The rms variation report writer can include monitoring site lists; event lists; SARFI summaries that compute the count or rate of voltage sags; IEC 61000-2-8 DISDIP tables; CBEMA, ITIC, SEMI F47, and timeline scatter plots; and magnitude, duration, and magnitude-duration column charts
Internet Accessibility via PQWeb
PQView can provide data and reports via the Internet or company intranet. Through PQWeb, also available from Electrotek Concepts, a server runs PQView data analysis tasks and allows you to access and view the results using any web browser. With this software, PQView becomes a multi-platform application, able to work across otherwise incompatible operating systems.
AI Website Generator