The Industry Standard for Power Quality Database Management & Analysis Software
PQView® Integrates Data from Power Quality Monitors, Digital Relays, Fault Recorders, Smart Meters, and SCADA Databases
PQView® 4
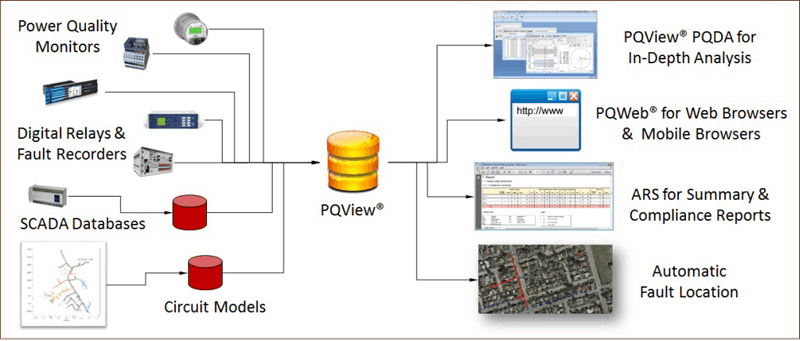
PQView® is a multi-component software system developed by Electrotek Concepts® and EPRI® for building and analyzing databases of power, power quality, and energy measurements. PQView integrates data from digital relays, fault recorders, power quality monitors, smart meters, and SCADA historians into an open relational database
PQView builds databases with billions of measurements from thousands of monitoring points taken by many different types of meters, including power quality monitors, voltage recorders, in-plant monitors, and digital fault recorders. It can store and analyze information with the measurements about cause and source of triggered events, as well as evaluate the financial impact of events to both a power provider and a power user. It can quickly extract meaningful information from a one megabyte or one terabyte database.
PQView combines powerful features in a user-friendly interface. Measurements can be stored in either Microsoft® Access or Microsoft SQL Server. A complete PQView system consists of three main applications: the Power Quality Data Manager (PQDM), the Power Quality Data Analyzer (PQDA), and PQWeb®
The Industry Standard for Power Quality Database Management & Analysis Software
PQView® Integrates Data from Power Quality Monitors, Digital Relays, Fault Recorders, Smart Meters, and SCADA Databases
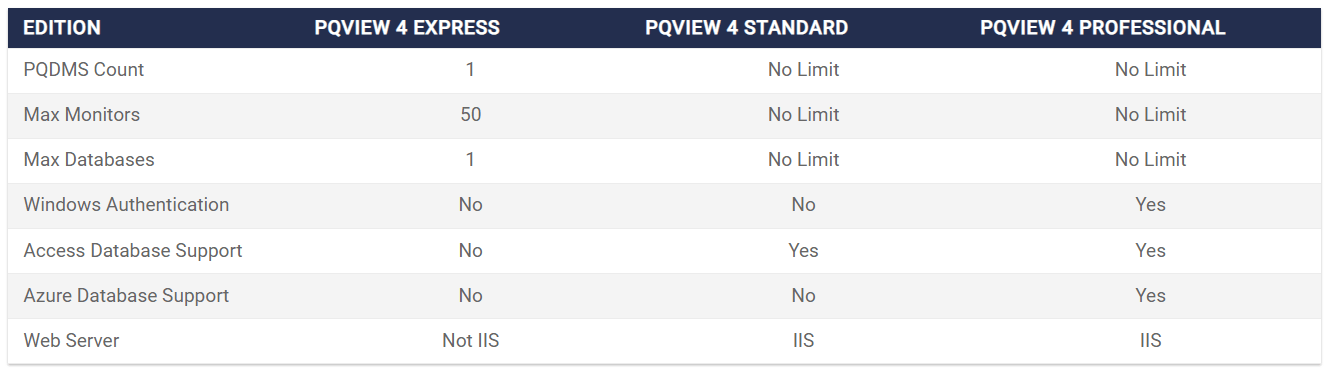
• Three PQView 4 Editions are available – Meets the needs of any budget or application
• Web-based user interface via PQWeb 4 – Fully interactive, responsive-designed website allows for viewing PQ data or even managing devices from any phone, tablet, or computer.
• Robust power quality data analytics
• Customizable compliance reporting
• Direct download of supported devices
• Single point of integration for multiple devices of various make and model—use same analysis tools regardless of monitoring device
• View data from multiple systems at once in large applications—Connect to multiple PQView Measurement Databases and multiple PQDMS instances in order to analyze data across multiple systems or manage communications with more than one monitoring system
• Designed using a service/server-based architecture – Runs unattended in order to import data, dispatch notifications, and serve up data and analytics as needed.
• Componentized for maximum flexibility – Software can be installed on a single server or across multiple machines as needed
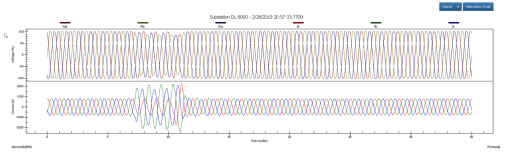
Event analysis
PQView can be used to display voltage and/or current waveforms from events. Derivations from waveform samples include interactive phasor charts, spectrum charts from one- to twelve-cycle FFT and DFT transformations, filtered charts, positive-, negative-, and zero-sequence components, voltage transformations through one to four transformer connections, and IEEE P1409 missing voltage. PQDA can quickly build event lists from the millions of events recorded in a measurement database. PQView “measurement events” consist of the waveform and rms samples recorded during voltage sags and swells due to faults and motor starting, and voltage transients due to fuse operations, lightning strikes, load switching, and capacitor and cable energizing. The event lists can be built based on simple queries that only select certain meters for a specific date range. Or, they can be more sophisticated, searching for single-phase sags, three-phase sags, single-phase faults, and three-phase faults.
RMS Voltage Variation Analysis
PQDA can build ITIC Charts, CBEMA Charts, and SEMI F47 Charts, and custom charts that overlay multiple curves. Measurements from each meter can be plotted optionally in a different color. Because PQDA’s rms variation analysis algorithm involves temporal aggregation of multiple events occurring closely in time, users see the event that resulted in a particular voltage magnitude and duration, along with any other events that occurred around the same time at that location.
The rms variation report writer can include monitoring site lists; event lists; SARFI summaries that compute the count or rate of voltage sags; IEC 61000-2-8 DISDIP tables; CBEMA, ITIC, SEMI F47, and timeline scatter plots; and magnitude, duration, and magnitude-duration column charts
Internet Accessibility via PQWeb
PQView can provide data and reports via the Internet or company intranet. Through PQWeb, also available from Electrotek Concepts, a server runs PQView data analysis tasks and allows you to access and view the results using any web browser. With this software, PQView becomes a multi-platform application, able to work across otherwise incompatible operating systems.
• Radial and network fault location
• Compliance with international and national power quality standards including EuroNorm EN 50160, the Colombian Energy and • Gas Regulatory Commission (CREG 024), and the Norwegian Water Resources and Energy Directorate (NVE 1557)
• Voltage sag and interruption contract management
• Power quality event log correlation with SCADA operation logs
• Load forecasting
• Wind generation feasibility and assessment
PQView 4 Express
PQView Express is intended for single-server installation. The installation of Express is a very simple process: it only requires running two installers (and upgrades only require one installer). PQView Express is recommended for small organizations, or for customers who wish to try out PQView in a simplified form. PQView Express does not use Microsoft IIS. The maximum number of monitors that can be integrated with PQView Express is 50.
PQView 4 Standard
PQView Standard is the next step up from Express. Standard includes all the features of Express, plus it supports distributed installations and uses Microsoft IIS. PQView Standard is recommended for system sizes larger than 50 monitors and/or organizations with infrastructures that require distributed installations.
PQView 4 Professional
PQView Professional includes all of the features of the Standard version and adds support for Windows Authentication, additional database support (MS Access and SQL Azure), and includes additional advanced analysis options unavailable in the Standard version.
Themes in the Mobirise website builder offer multiple blocks: intros, sliders, galleries, forms, articles, and so on. Start a project and click on the red plus buttons to see the blocks available for your theme.
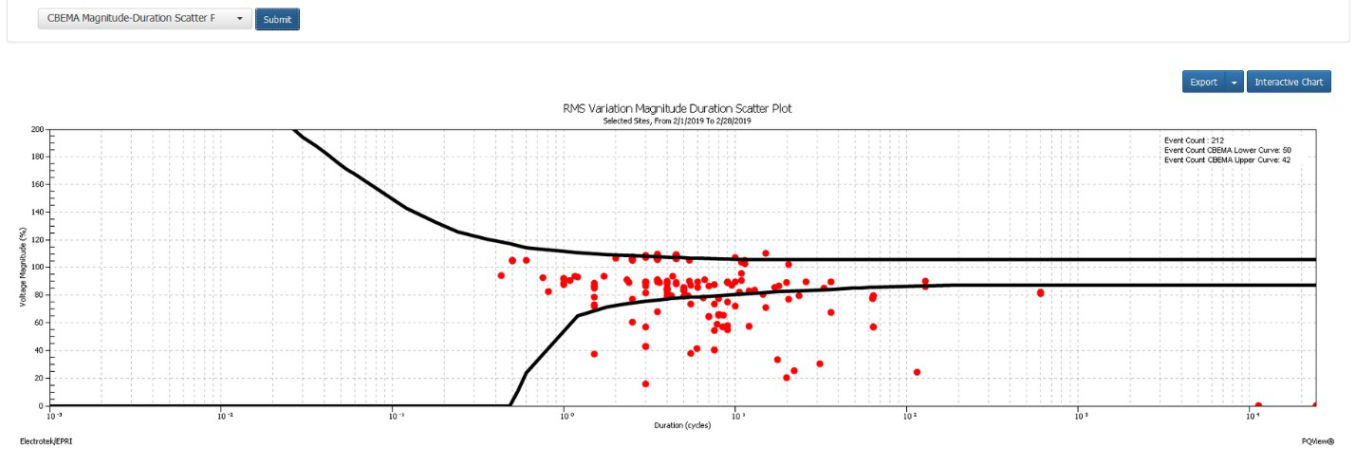
The charts below are a sampling from the scores of methods provided by PQView to analyze RMS variations. An RMS variation can be subcategorized as a voltage sag or voltage dip, voltage swell, undervoltage, overvoltage, momentary interruption, or sustained interruption.
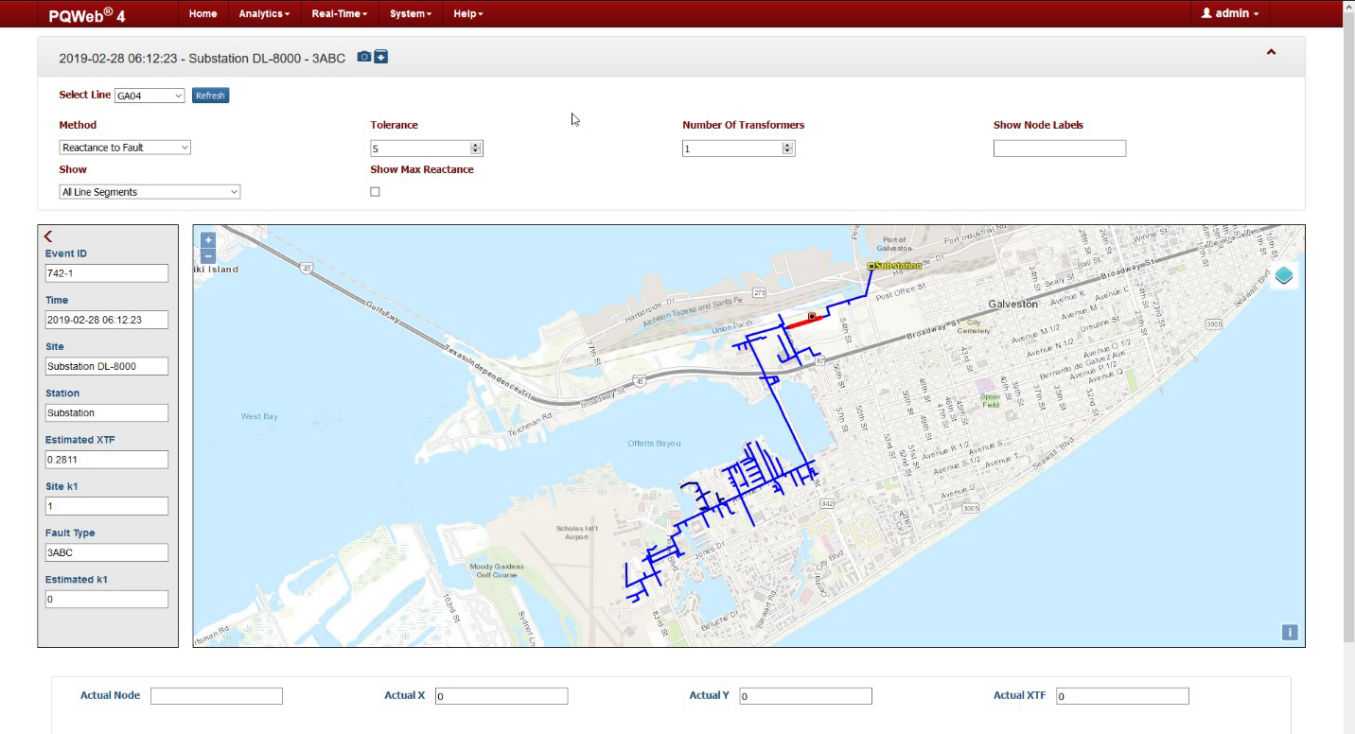
Charts useful for analyzing and/or locating transmission and distribution system faults.
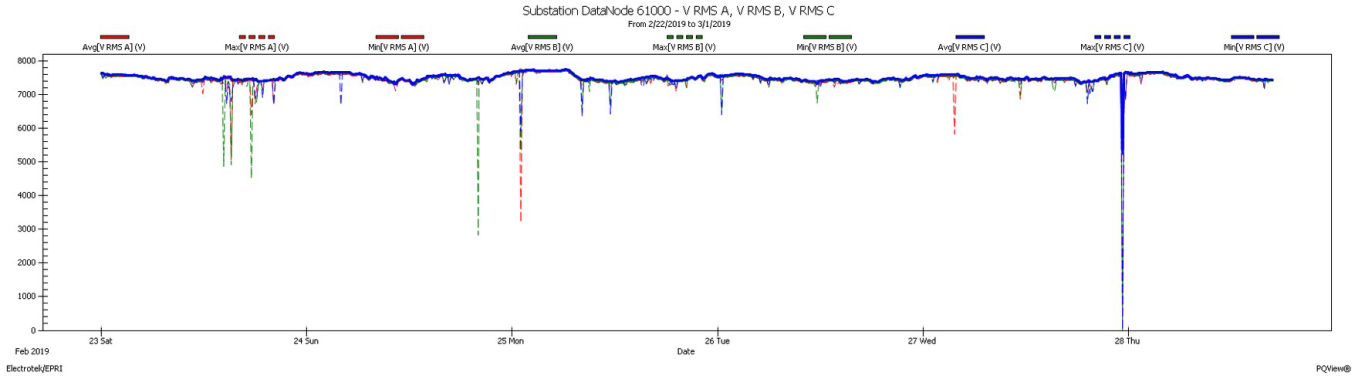
Charts showing analysis of steady-state measurements, interval measurements, and snapshot measurements.
For more information, you can visit electrotek.com

AI Website Builder